5.1 Descriptive Statistics: Some popular Displays of Data
5.1.1 Organizing Qualitative Data
Frequency and Relative Frequency Tables
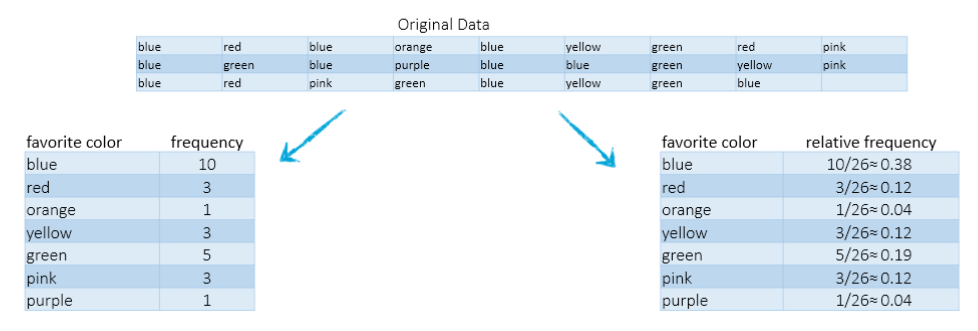
A frequency distribution lists each category of data and the number of occurrences for each category
The relative frequency is the proportion (or percent) of observations within a category.
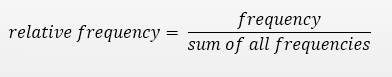
A relative frequency distribution lists each category of data together with the relative frequency of each category.
Bar Graphs
| favorite color | frequency |
| blue | 10 |
| red | 3 |
| orange | 1 |
| yellow | 3 |
| green | 5 |
| pink | 3 |
| purple | 1 |
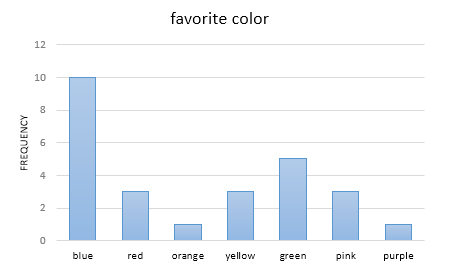
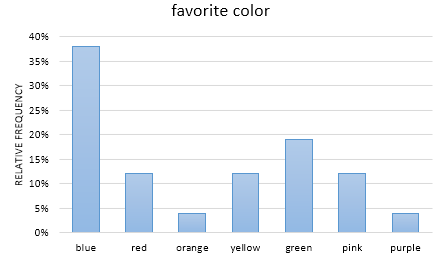
Bar Graphs / Bar Charts
- heights can be frequency or relative frequency
- bars must not touch
| favorite color | relative frequency | |
| blue | 10/26≈ | 0.38 |
| red | 3/26≈ | 0.12 |
| orange | 1/26≈ | 0.04 |
| yellow | 3/26≈ | 0.12 |
| green | 5/26≈ | 0.19 |
| pink | 3/26≈ | 0.12 |
| purple | 1/26≈ | 0.04 |
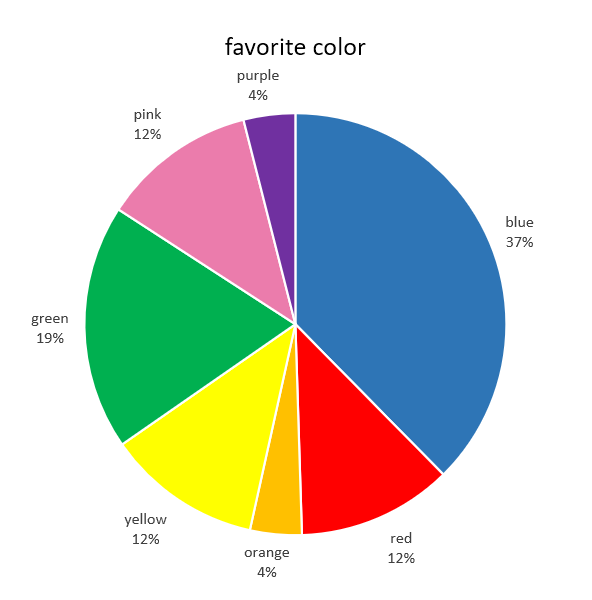
Pie Charts
Pie Charts
1.should always include the relative frequency
2.also should include labels, either directly or as a legend