5.1 Descriptive Statistics: Some popular Displays of Data
5.1.3 Summarizing Data Numerically
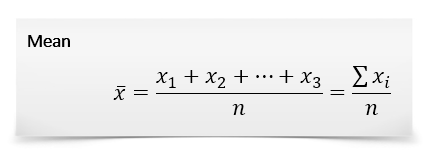
Measures of Central Tendency
Advantages:
- It works well for lists that are simply combined (added) together.
- Easy to calculate: just add and divide.
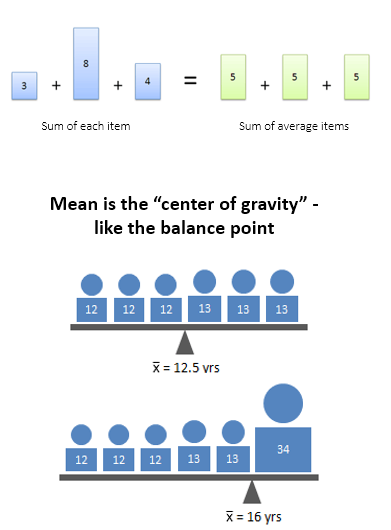
- It’s intuitive — it’s the number “in the middle”, pulled up by large values and brought down by smaller ones.
Disadvantages:
- The average can be skewed by outliers — it doesn’t deal well with wildly varying samples.
- The average of 100, 200 and -300 is 0, which is misleading.
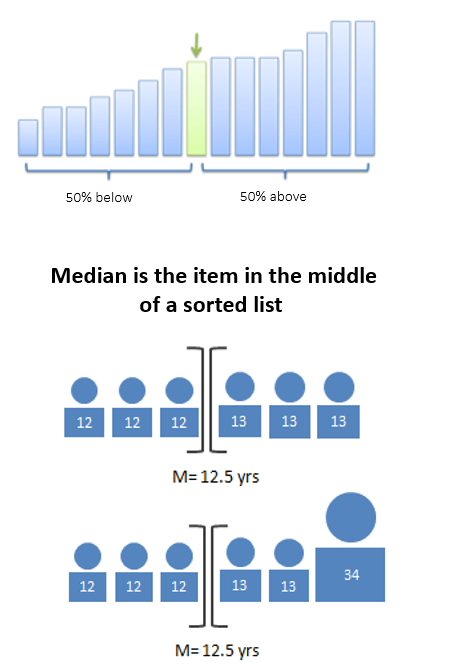
Advantages:
- Handles outliers well — often the most accurate representation of a group
- Splits data into two groups, each with the same number of items
Disadvantages:
- Can be harder to calculate: you need to sort the list first
- Not as well-known; when you say “median”, people may think you mean “average”
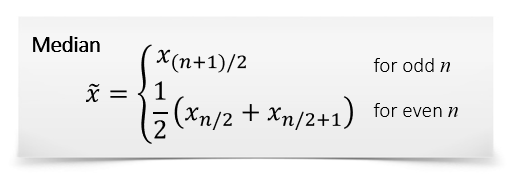
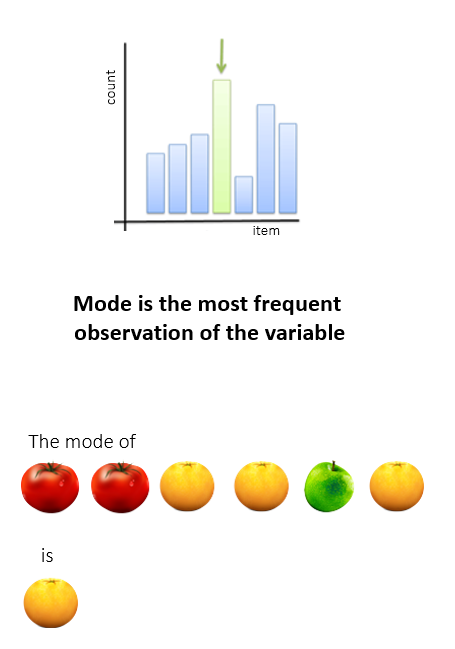
Mode
Advantages:
- Works well for exclusive voting situations (this choice or that one; no compromise), i.e., for nominal data
- Gives a choice that the most people wanted (whereas the average can give a choice that nobody wanted).
- Simple to understand
Disadvantages:
- Requires more effort to compute (have to tally up the votes)
- “Winner takes all” — there’s no middle path
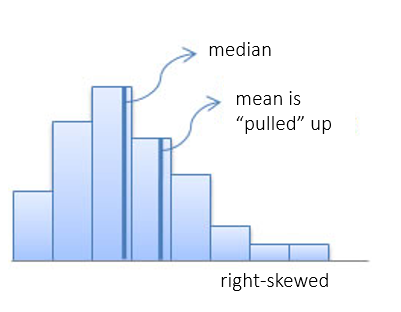
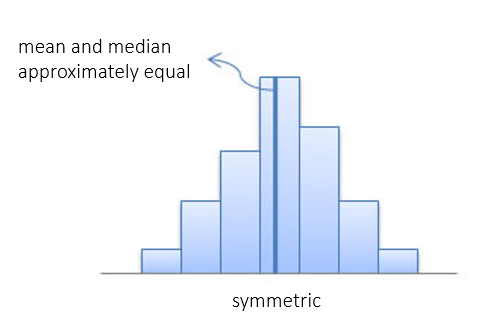
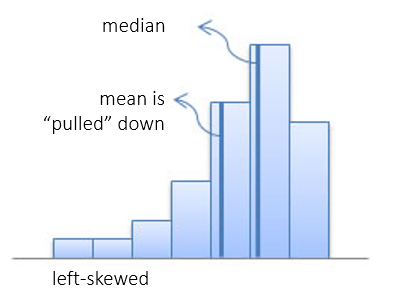
Measures of Central Tendency:
Using Mean and Median to Identify the Distribution Shape
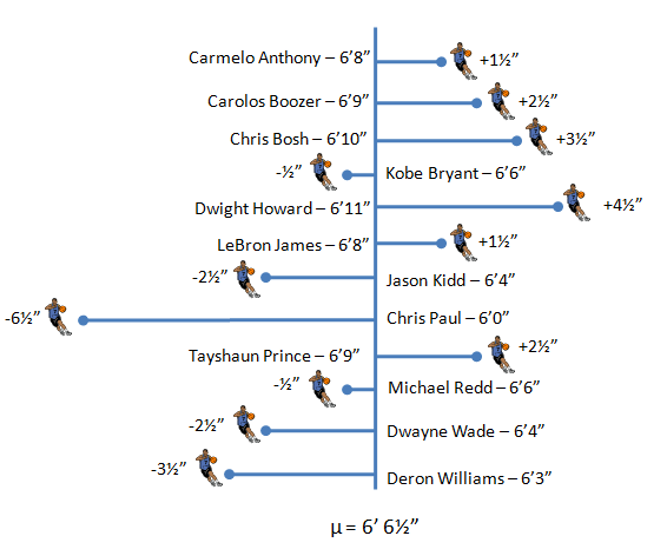
Measures of Dispersion
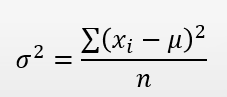
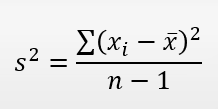
Variance is the average of the squared distance form the mean
Population Variance
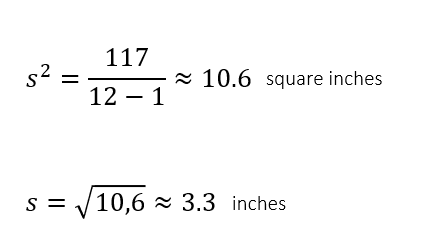
Sample Variance
Why Variance?
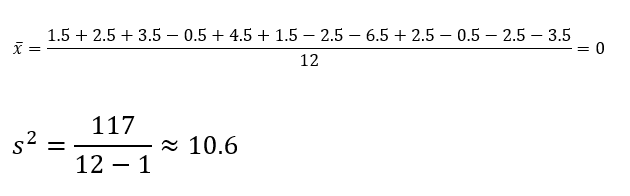
Mean acts as a balancing point. Hence, the average difference from the mean will equal zero.
When calculating variance, all differences are squared, so that negative differences do not compensate positive differences.
Standard Deviation
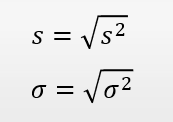
Standard Deviation keeps the units of the original measure
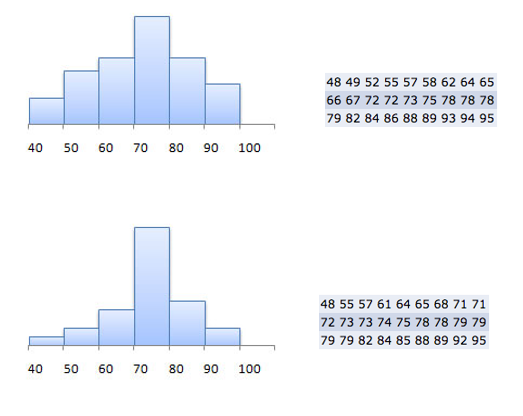
Which data set has a higher standard deviation?
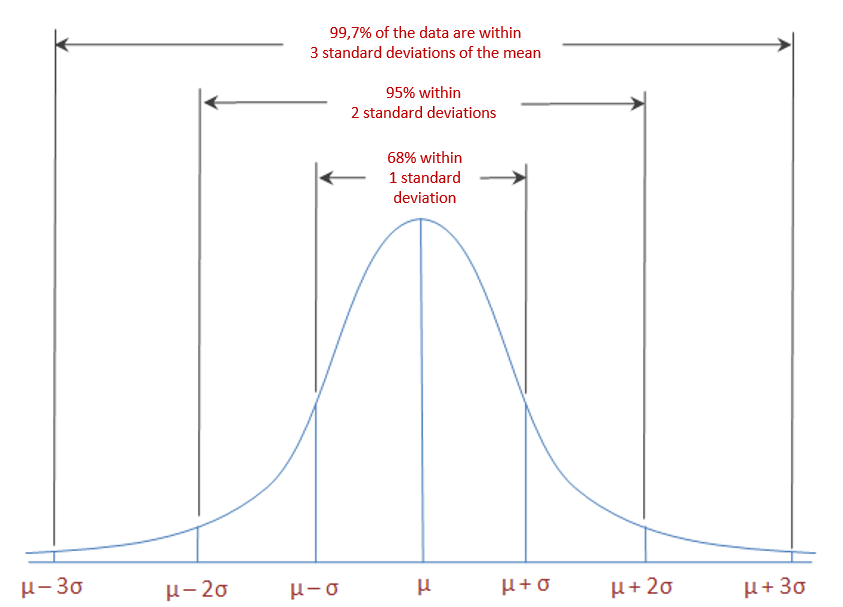
Relationship between the Standard Deviation and the Shape of the Normal Distribution