

How many respondents are enough? It's a question everyone planning a survey runs into. Fortunately, science has an answer. In this article we explain how the required sample size is determined — and how you can calculate the sample size yourself.
If you're not interested in the technical details and just want to calculate the sample size quickly, use the QUESTIONSTAR sample-size calculator.
What is a representative sample?
When we ask about opinions, attitudes or information on behavior in a survey, we usually want to determine how widespread these are within the group of people we're interested in.
These can be a company's existing or potential customers, its employees, the residents of a particular city ahead of a mayoral election, or the entire population of a country.
The totality of these people whose opinion we're interested in is called the population.
In most cases, it's impractical to survey every person belonging to the population. Quite apart from the fact that we can only rarely contact each individual and ask them to participate, such a full census would simply be too expensive and too slow.
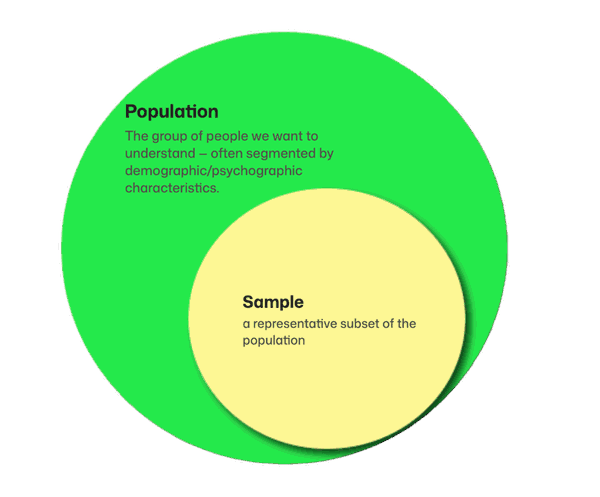
That's why science grappled with the question of whether and to what extent it's possible to survey only a small number of people from the population — and still get answers that are characteristic of the population, that is, representative.
This subset is called a sample. Just as the baker pierces the bread in various spots to check whether it's evenly baked, statisticians "pierce" into different parts of the population to check whether the people within it are similarly "baked."
Statistics' answer to this question was a clear yes-and-no.
No — because it's impossible to arrive at exactly the same answer from a sample as you would from surveying the entire population.
Yes — because probability theory makes it possible to estimate how far the true value (e.g. average income, or the share of those who prefer product X) in the population can deviate from the value determined in the sample. In other words: it's possible to estimate the interval in which the true value most likely lies.
The prerequisites for being able to calculate this interval are:
- Random sampling — every person in the population has the same chance of ending up in the sample.
- A certain minimum number of respondents (sample size) must be reached.
If both prerequisites are met, the sample is considered representative of the population. The insights gained this way can be transferred to the population — and we can state the probability with which we're sure we're not making an error in doing so.
What happens if the sample size is chosen incorrectly?
The consequences of choosing the wrong sample size are quite simple:
- If the sample is too small, the survey results can't be generalized to the population — the parameters in the population can't be estimated with the desired precision.
- If the sample is too large, it won't harm the results, but the cost of data collection can turn out higher than necessary. This becomes especially noticeable when using panels, where each respondent costs several euros.
The margin-of-error approach to calculating sample size
Whenever we make statements about the population based on a sample, we make an error. This error results from the fact that we don't survey the entire population, but only a part of it.
Provided the sample was drawn randomly, this error can be calculated using probability theory — and the range in which the true value in the population lies can be stated.
This range is called the confidence interval and works out as "measured value ± margin of error."
The formula for calculating the margin of error (for an infinitely large population) looks as follows:
Where:
E — margin of error (as a percentage, expressed in decimals).
z — the difference between the value observed in the sample and its theoretical mean that is maximally permissible for the specified confidence level.
The z-value sets the width of the confidence interval — but in terms of the number of standard deviations of the standard normal distribution. All the other parameters in the formula serve only to translate the z-value into the more understandable unit of the maximally permissible percentage deviation.
Z-values for various confidence levels can be determined using the so-called z-table. In survey research, the following confidence levels and z-values are typically used:
| Vertrauensniveau | z-Wert |
|---|---|
| 90 % | 1,65 |
| 95 % | 1,96 |
| 99 % | 2,58 |
Higher confidence levels correspond to higher z-values. That's why the margin of error also grows larger for higher confidence levels.
π — the share of the characteristic in the population (as a percentage, expressed in decimals). The π-value can vary between 0% and 100%.
As a rule, the π-value isn't known ahead of a survey. In such cases you set it to 50% (0.5). The expression π · (1 − π) has its maximum at π = 0.5 — which yields the highest E-value across all possible π-values. This ensures that even in unfavorable cases the calculated confidence interval includes the true value, or that a sufficiently large sample is generated.
Values of π that deviate upward or downward from 0.5 produce smaller margins of error. At π = 0 and π = 1 the margin of error equals 0.
So if you know the share of the characteristic of interest in the population before conducting your survey, you can significantly reduce the margin of error — and thus the required sample size as well.
Example. In your study you're investigating what share of students owns their own laptop. Since nothing is yet known about this for the defined population, you use the value π = 0.5. It turns out that 67.5% of respondents answered this question in the affirmative. If you repeat the study with the same population, you now use the value π = 0.675 — which reduces the required sample size.
n — the number of people surveyed, i.e. the sample size.
Now that we've clarified the meaning of all the parameters, the formula can be rearranged — to calculate the sample size:
The procedure for calculating the sample size is then quite simple:
- Choose the margin of error that should apply to the survey results.
- Choose the confidence level.
- Determine the z-value that corresponds to the chosen confidence level.
- If the share of the characteristic of interest in the population is known, use it as π. Otherwise set π = 0.5.
- Insert the values into formula (2) and calculate the sample size.
With that you've determined the sample size for the case of an unknown or infinitely large population.
Sample size for a finite population
In cases where the required sample size becomes comparable to the size of the population, even smaller samples are enough for representativeness.
In this case, the variance of the characteristic not captured by the sample becomes comparable to the captured variance, so the margin of error can be corrected downward by the so-called Finite Population Correction (FPC) factor:
where N stands for the size of the population.
The formula for calculating the margin of error thus takes the following form:
The value of FPC lies between 0 and 1.
The closer the sample size (n) is to the size of the population (N), the smaller FPC becomes. Consequently, the margin of error also turns out smaller.
The smaller the sample size is compared to the population, the closer FPC is to 1 — the factor loses significance, and formula (4) reduces to formula (1).
The formula for the sample size taking FPC into account is obtained by solving formula (4) for n:
The sample size can be calculated analogously to the previous procedure:
- Determine the values for E, z, π and N.
- Insert them into formula (5).
- Calculate the required sample size.
Alternatively — and especially helpful for manual calculation — you can also proceed as follows:
- Calculate the sample size for an infinite population using formula (2).
- If the calculated sample size amounts to more than 5% (or at the latest 10%) of the population, calculate the corrected sample size using formula (6):
n_corr is the required sample size.
Example. We're conducting an employee survey that should be representative of the entire company — with a margin of error of 5% and a confidence level of 95%. Using formula (2) we calculate the required sample size:
n = (1.96² · 0.5 · 0.5) / 0.05² = 385.
However, only 100 employees work at our company. So a correction is necessary. Using formula (6):
n_corr = 385 / (1 + (385 − 1) / 100) = 80.
In the end, we have to survey 80 employees for the survey to count as representative of all our company's employees.
QUESTIONSTAR sample-size calculator
If you'd rather not work through the math by hand, use the QUESTIONSTAR sample-size calculator — it takes the calculation off your hands and works with all the formulas described above.
The calculator is freely accessible, with no registration and no data storage. You can use it as often as you like — including for other people's projects.