

Likert scales are one of those tools everyone uses and no one thinks about anymore. Which is exactly why a second look pays off.
In this article we cover the most important general considerations for constructing Likert scales. If you're looking directly for concrete examples and wording suggestions, though, our other blog article offers a comprehensive overview of common Likert scales.
About Likert scales
Named after its developer Rensis Likert (1903–1981), the Likert scale is a widely used rating scale on which respondents indicate the extent to which they agree or disagree with a statement.
Typically this is done via a 5- or 7-point scale that runs from one extreme to the other — for example from "strongly disagree" to "strongly agree."
Likert scales are so popular because they are easy to understand, simple to create, intuitive to answer and easy to analyze. These very qualities make them a standard instrument in today's survey research — not only for measuring attitudes, but also opinions, perceptions, behaviors and much more.
At first glance Likert scales look simple — and that's exactly what makes them so popular. But behind that simplicity lies a certain amount of conceptual care. Anyone working with Likert scales should know a few basic principles in order to obtain reliable and meaningful results.
In what follows, we go through the most important aspects to consider when designing Likert scales:
Number of response categories
Traditionally, Likert scales are used with 5 to 7 response categories. In practice, though, scales with as few as two or as many as eleven scale points are occasionally used. How many scale points you should use in a given case depends on several considerations:
As a basic rule: the higher the number of response categories, the finer the distinctions the scale can capture. On the other hand, respondents can only meaningfully handle a limited number of response options. To resolve this trade-off in your specific case, you can take the following aspects into account:
Respondents' involvement and knowledge
The more your respondents know about the matter under study, or the more strongly they are interested in it, the better they can recognize and also name fine distinctions.
Example: In a survey of wine connoisseurs evaluating different wines, finely graded taste notes can be placed precisely — here, using a scale with many response points makes sense.
On the other hand: If your target group has only a superficial understanding of the topic — for instance because the respondents are not wine connoisseurs, or because the survey collects general assessments on a barely known political matter — the necessary capacity to differentiate is often lacking.
In such a case, a scale with many response points would seemingly register finer distinctions, but these would not be meaningful — merely chance or noise. That undermines data quality and complicates the analysis.
In such cases, it's better to use shorter scales — they deliver more reliable and more robust results.
Nature of the objects
Sometimes the decision for a particular scale length also depends on the nature of the objects or concepts being evaluated. Some objects are by nature characterized by fine distinctions — for example when evaluating the comfort of hotel rooms or the sound quality of speakers. For other matters — for instance simple everyday products such as tissues or batteries — finely graded ratings are less useful, since they don't reflect a differentiated perception.
Mode of data collection
The way your survey is conducted can also influence the choice of a suitable scale length. If, for instance, the questions are read aloud by an interviewer — say at trade fairs, at points of sale, or in telephone interviews — you should bear in mind that most respondents can only take in and remember a few alternatives by ear. In such cases, a shorter scale with a maximum of 5 response categories is advisable.
With online surveys too, especially when respondents fill them out on a smartphone, you should make sure that the entire scale fits on the screen without scrolling. Otherwise unwanted response biases will inevitably arise.
Data analysis
How do you plan to analyze your data? For what purpose do you want to use the survey results? This too plays a decisive role in choosing the right scale length.
If you only want to analyze the data in aggregate — for example computing means, making general statements, or comparing groups — a longer scale is usually not worth it. In that case it's better to use shorter scales.
If, however, you want to examine causal relationships or carry out more demanding statistical analyses, longer scales are advantageous. For example, the correlation coefficient — a frequently used measure of the relationship between variables — is substantially influenced by the number of response categories. The fewer response categories your scale has, the lower the correlation coefficient will tend to be. This directly affects all analyses based on correlations, and regression models in particular.
Even or odd number of response options
A scale with an odd number of response categories has a clear midpoint that allows for a neutral rating. This neutral category lets respondents express that they have no clear opinion about a matter or object — or "opt out" of a definite stance without having to engage more closely with the question.
So you have to weigh whether to offer a neutral middle category in your scale or would rather use a scale with an even number of response options without a middle. This decision depends on several factors:
Respondents' knowledge and the sensitivity of the topic
If it can be assumed that at least some of your respondents have no clear opinion — for instance because they lack the necessary information or the topic is too specific (e.g.: "How do you assess the new EU data protection directives?") — a scale with an odd number of response categories is advisable. If this neutral option is missing, you force respondents into a stance that may not reflect their actual attitude. This can considerably distort the central tendency and variance of the results.
With sensitive topics in particular — for instance questions about political convictions or ethical attitudes ("What is your view on euthanasia?") — respondents should have the option of choosing a neutral answer. Without this option, the risk rises that they feel uncomfortable, which in turn could influence their further answers or even lead to drop-offs.
One possible compromise for resolving this trade-off is to offer, in addition to the scale, an option such as "don't know" or "no answer." This gives you clear, high-contrast answers from those who do have an opinion, while at the same time offering a suitable alternative to those who feel uncomfortable or genuinely have no opinion.
Research goals
In other situations, by contrast, it may be expressly desirable to obtain clear positions and high-contrast opinions. This is particularly sensible when concrete decisions are to be derived from the results — for example, whether a particular measure should be introduced or rejected ("Should the cafeteria serve exclusively vegetarian food?"). In such cases neutral answers add no value. Here an even number of response categories without a middle is advisable in order to obtain unambiguous results.
General recommendation
The choice of an even or odd number of response options can substantially influence the results and the conclusions drawn from them. In general: most respondents do have an opinion on topics they are familiar with. You should therefore make sure that your target group has enough information to give an honest and well-founded assessment.
Labeling the scale points
Should every scale point be labeled, or is labeling just a few points enough?
There is no clear evidence that labeling all scale points is better than labeling only a few selected ones. On the contrary, research shows that it makes no substantial difference whether every single point or only selected scale points are labeled.
On the contrary: too many words and overly nuanced labels can even confuse respondents — for instance when the terms can hardly be told apart clearly anymore (e.g. "rather positive" vs. "fairly positive").
Far more important is to avoid ambivalence and ambiguity in the labeling. It must be clear to respondents at all times which continuum the scale represents. This is best achieved by clearly labeling the two poles of the scale and, with an odd number of response options, also clearly marking the middle.
Reduced labeling is especially useful when little space is available — for instance when using sliders or in matrix questions, where fully labeling every scale point can quickly look cluttered.

Peaked vs. flat response distribution
Another important aspect concerns the wording of the scale poles — that is, how extreme the endpoints of the scale are phrased.
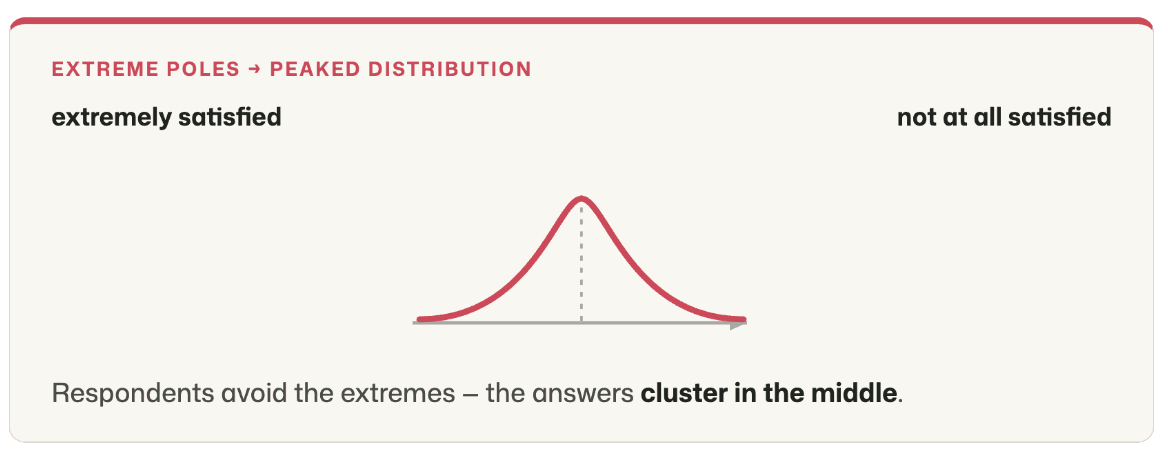
- Extremely worded poles (e.g. "extremely satisfied" vs. "not at all satisfied") usually produce a more peaked response distribution, since respondents choose the extreme response options less often and their answers cluster more toward the middle.
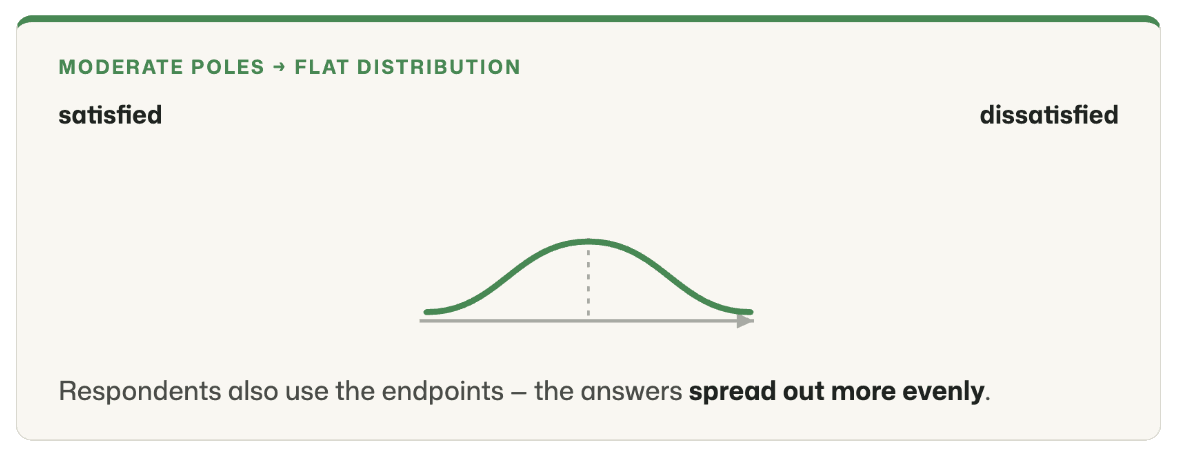
- More moderately worded poles (e.g. "satisfied" vs. "dissatisfied"), by contrast, lead to a flatter response distribution, since respondents have fewer inhibitions about using the outermost scale points. This allows for a more differentiated distribution of answers along the entire scale.
Which variant you choose depends on your research goal:
- If you want to make differences of opinion visible and provoke as clear-cut positions as possible, moderate poles are advisable (flatter distribution).
- If, on the other hand, you want to sharply delineate extreme opinions and surface only clear, strong positions, you should choose extreme poles (more peaked distribution).
So weigh carefully which distribution fits your survey goals.
The curious history of Likert scales
Originally, the Likert scale was developed to measure attitudes. In the 1930s, psychologists began to grapple with the question of how one could even measure abstract constructs like attitudes.
The central problem: attitudes are invisible and not directly observable. People can have quite different reasons for liking or rejecting an object — such as taste, appearance, or personal experiences. To make these individual assessments comparable, a systematic approach was needed.
This is exactly where the American psychologist Rensis Likert came in with an idea as simple as it was ingenious: he proposed splitting the attitude toward an object into several individual aspects, or so-called dimensions. For each of these dimensions he formulated a statement. Respondents were then to indicate the extent to which they agreed with these statements — typically using a five- or seven-point scale.
The individual answers were then aggregated into an overall score, which yielded a uniform and therefore comparable measure of a person's attitude — regardless of which dimensions a given person weighted especially heavily.
A simple example: The attitude toward an apple might be composed of dimensions such as taste, appearance, smell, juiciness, color, variety, shape, or size. All these aspects together form the so-called latent construct "attitude toward the apple."
Likert's great achievement, then, was not the development of a rating scale as such — such scales existed long before him — but the idea of measuring attitudes through several statements about different facets of an object and aggregating them. The central challenge with this approach was (and to this day remains) selecting, from the multitude of possible statements, precisely those best suited to actually capture the latent construct. This process is called scale construction and validation.
With this, Likert effectively opened the way to measuring latent constructs with so-called multi-item scales. He set off a veritable wave of new measurement methods with which researchers began to measure the most varied latent constructs — from job satisfaction through brand image, trust, loyalty, and engagement all the way to personality traits or societal attitudes.
Over time, moreover, it was no longer only agreement scales that were used; ratings such as importance, probability, preference, or frequency also became established.
Curiously, in the process the term "Likert scale" has, in common usage, detached itself from Likert's original idea — namely multi-item measurement with an agreement scale — and today refers above all to the rating scale itself, that is, the response format.
So today we live with the peculiar fact that what we usually call a Likert scale is not at all what was originally meant by it.
By the way, Likert's original work appeared in 1932: Likert, R. (1932). A technique for the measurement of attitudes. Archives of Psychology.
Date: 04/10/2025
Author: Dr. Paul Marx
This text is protected by copyright. All rights reserved.
You might also be interested in: