

How to calculate CSAT, how precise your score is and which questions fit which touchpoint. With a free CSAT calculator, a worked example and templates.
A single question after a call to customer support, an order, or a service appointment: "How satisfied were you?" The Customer Satisfaction Score (CSAT) captures satisfaction with that specific touchpoint at that moment. The question is quick and easy to answer, and the results can be compared across survey waves.
In short: CSAT is the share of respondents who chose a 4 or a 5 on a scale from 1 to 5, that is, "somewhat satisfied" or "very satisfied". As a formula: CSAT = answers with 4 or 5 / all answers × 100%. If 160 of 200 customers answered with a 4 or a 5, CSAT is 80%. This counting rule is called top-2-box. How precise the score is depends on the number of answers.
CSAT calculator
Under "Enter counts", type in how many answers fell on each level from 1 to 5, or use "Paste answers" or "Load file". Under "Counting rule", you switch between "Top-2-box (4 and 5), the usual rule" and "Top-box (5 only)". The calculator also shows the "95% confidence interval", and under "Compare two values" it compares your score with a second measurement. I explain the calculations further below.
The example file shows how to arrange your data: Excel, CSV. It contains the 200 answers from the online store example below and also calculates CSAT as top-2-box and as top-box, each with its 95% Wilson confidence interval, directly in Excel.
Calculate CSAT
How many answers were there at each point? Scale 1 to 5: 1 = very dissatisfied, 5 = very satisfied
Enter the number of answers or paste the answers.
The interval shows how much the value can vary simply because these people, and not others, happened to answer. Systematic bias, for example because dissatisfied customers answer less often or the question is leading, is not included.
The calculator runs in your browser and doesn't send any data.
How CSAT is measured
Respondents typically answer on a five-point scale, from "very dissatisfied" (1) to "very satisfied" (5).
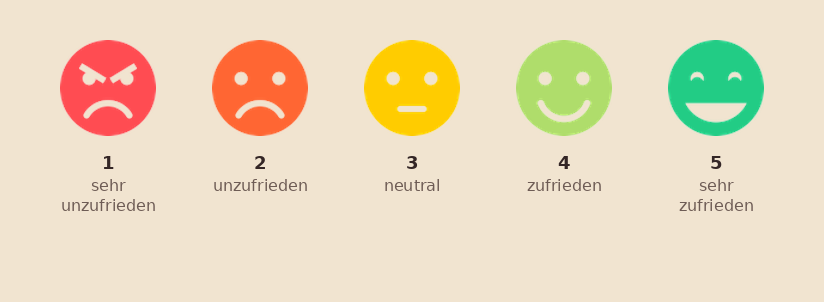
The CSAT score is the percentage of respondents who gave a rating of 4 or 5, the so-called top-2-box. Some studies argue instead for the top-box (5s only), which is a design decision. We recommend top-2-box as the default: established, stable, and easy to compare.
By answers I mean valid responses on the scale from 1 to 5. Missing answers, "don't know" and values outside this scale don't count toward the denominator and are reported separately. Without valid answers, CSAT can't be calculated.
The score ranges from 0% (nobody chose 4 or 5) to 100% (everyone chose 4 or 5).
How to calculate CSAT: formula and example
A very small example
Let's look at an auto repair shop that asks ten customers when they pick up their car: "How satisfied were you with your visit to our repair shop?" The scale has five levels with a neutral midpoint:
| Level | Meaning | Answers |
|---|---|---|
| 1 | very dissatisfied | 1 |
| 2 | somewhat dissatisfied | 1 |
| 3 | neither satisfied nor dissatisfied | 1 |
| 4 | somewhat satisfied | 4 |
| 5 | very satisfied | 3 |
For this CSAT calculation, customers who chose 4 or 5 count as satisfied. That is 4 + 3 = 7 out of 10. So CSAT is 7 / 10 = 70%. If you count only the 5s, the so-called top-box, it's 3 out of 10 = 30%. Top-box means the highest rating, top-2-box means the highest and the second-highest together (Linke 2018, p. 105).
So the same ten answers give you 70% or 30%, depending on what you count. That's why every CSAT needs a note saying whether it means the top-box or the top-2-box.
Why count shares at all instead of simply taking the mean? Because the mean alone can lead to a wrong conclusion. Linke (2018, p. 105) describes this for employee surveys, and with customers it's no different. Imagine two repair shops with ten answers each. In the first, everyone chooses a 3. In the second, half choose a 1 and the other half a 5. Both have a mean of 3.0. But in the first, nobody is satisfied, while in the second, half are very satisfied and the other half very dissatisfied. CSAT shows the difference: 0% versus 50%.
Worked example: 200 answers
Now a more realistic example. An online store asks 200 customers after delivery. Here's how the answers are distributed (made-up numbers):
| Level | 1 | 2 | 3 | 4 | 5 |
|---|---|---|---|---|---|
| Answers | 6 | 9 | 25 | 70 | 90 |
Step 1, count the satisfied customers: 70 + 90 = 160. As a check: 6 + 9 + 25 + 70 + 90 = 200.
Step 2, divide by all answers: 160 / 200 = 0.80.
Step 3, multiply by 100%: CSAT is 80% (top-2-box).
The top-box counts only the 90 customers with a 5, so 90 / 200 = 45%.
All 200 answers belong in the denominator, including the 25 with the neutral 3. A common mistake is to leave them out. Then you'd get 160 / 175 ≈ 91.4%, more than eleven percentage points too high, just because the denominator is wrong.
By the way, in QUESTIONSTAR you calculate CSAT with the NPS question and your own thresholds. You set the scale to 1 to 5 and specify that levels 4 and 5 count as promoters. The share of promoters in the report is then your CSAT as top-2-box. Read the share of promoters there, not the Net Score, because the difference between two shares has no meaning for CSAT. How levels 1 to 3 are assigned doesn't matter for CSAT. The calculator above adds the interval and the comparison of two measurements.
How precise is your CSAT?
The online store measured 80%. With a different sample of 200 customers, it might have come out at 77% or 83%. The confidence interval shows how far a result can fluctuate purely because of chance in who was selected, much as with the Net Promoter Score.
Why the calculator uses the Wilson interval
There's a simple formula for shares: share ± 1.96 · √(share · (1 − share) / n), where n is the number of answers. It's called the Wald interval. With many answers and shares near the middle, it works well. At the edges, it fails.
Let's look at an example. Ten out of ten customers are satisfied. The share is then 1, and under the square root you get 1 · 0 / 10 = 0. The interval runs from 100% to 100%, as if you were completely certain after ten answers. Of course you aren't.
That's why the calculator uses the Wilson interval, a standard method for shares (NIST/SEMATECH n.d.). Its center lies a little closer to 50% than the measured share, and it always stays between 0 and 100%. For the ten satisfied customers, it gives ≈ 72.2% to 100%. That fits better with what ten answers can tell you: the score is rather high, but you don't know yet exactly how high.
Wilson interval (95%)
center = (p + z² / (2n)) / (1 + z² / n)
half width = z / (1 + z² / n) · √(p · (1 − p) / n + z² / (4n²))
interval = center ± half width
p is the share as a decimal, n the number of answers, z = 1.96 for 95%.
Rather than reading the formula as a whole, go through it piece by piece. For the online store, p = 0.80 and n = 200:
- z² = 1.96² = 3.8416, so z² / n ≈ 0.0192 and z² / (2n) ≈ 0.0096.
- center = (0.80 + 0.0096) / 1.0192 ≈ 0.794.
- Under the square root: 0.80 · 0.20 / 200 = 0.0008, plus 3.8416 / 160,000 ≈ 0.000024. The square root of 0.000824 is ≈ 0.0287.
- half width = 1.96 / 1.0192 · 0.0287 ≈ 0.0552.
So the interval runs from ≈ 73.9% to ≈ 85.0%. The simple formula would have given almost the same here, ≈ 74.5% to ≈ 85.5%. With 200 answers and a share of 80%, the difference is small. It becomes large with few answers and with shares close to 0 or 100%. For the top-box of 45%, the Wilson interval gives ≈ 38.3% to ≈ 51.9%.
For the measured CSAT of 80%, the 95% Wilson confidence interval is approximately 74% to 85%. The 95% describes the procedure. If the store surveyed 200 random customers again and again, about 95 out of 100 intervals calculated this way would contain the true value. And the interval accounts only for this random variation. If mostly the most satisfied customers respond, the interval won't help you. With fewer than 30 answers, the calculator points out the small sample size. The Wilson interval is based on an approximation that can then be less reliable. The width of the interval also depends on the share of satisfied customers.
Comparing two measurements
Has CSAT gone up, or does it only look that way? Let's assume a hotline asks 150 callers in each of the first and second quarters (made-up numbers). For this comparison, we assume two random samples drawn independently of each other, with one answer per person. If the same people are surveyed again, the comparison needs an analysis of paired answers.
| Q1 | Q2 | |
|---|---|---|
| Answers | 150 | 150 |
| Satisfied (4 or 5) | 114 | 126 |
| CSAT | 76% | 84% |
| 95% interval (Wilson) | ≈ 68.6 to 82.1% | ≈ 77.3 to 89.0% |
CSAT has risen by 8 percentage points. Let's check whether that can be more than chance.
Step 1, the standard error of each measurement: √(0.76 · 0.24 / 150) ≈ 0.035 and √(0.84 · 0.16 / 150) ≈ 0.030.
Step 2, the standard error of the difference: √(0.035² + 0.030²) ≈ 0.046, so ≈ 4.6 percentage points.
Step 3, the difference divided by its standard error: 8 / 4.6 ≈ 1.7. This value is called z. In the two-sided test used here, an absolute value of z of about 1.96 or more counts as statistically significant at the 5% level. The corresponding p-value is ≈ 0.08.
So with 150 answers per quarter, a rise of 8 percentage points could still be due to chance, and the intervals overlap considerably. If the hotline had asked 400 callers each time, with the same shares, z would be ≈ 2.8 and the p-value ≈ 0.005. The same rise would then be statistically significant. So it's not only the size of the difference that matters, but also the number of answers. The calculator above runs this comparison with a z-test for two proportions when you enter a second measurement under "Compare two values".
How many answers do you need?
You can also ask the reverse question. For an approximate margin of error of ±5 percentage points at a 95% confidence level, with independent random observations, plan with:
n = 1.96² · p · (1 − p) / 0.05²
This formula gives an approximation for planning. If you expect a CSAT of about 80%, that's 3.8416 · 0.16 / 0.0025 ≈ 245.9, rounded up 246 answers. If you don't know anything about the score yet, calculate with 50%, the worst case: ≈ 384.2, rounded up 385 answers. For ±10 percentage points, the same planning gives 62 and 97 answers respectively. It's the same formula as in the article Calculating sample size, where you'll find all the details.
What is a good CSAT score?
There's no universal threshold. How high CSAT turns out depends on the industry, on the exact wording of the question, on the touchpoint and on the channel you use to ask. That's why QUESTIONSTAR doesn't provide industry benchmarks. And just choosing between top-2-box and top-box turns the same answers into either 80% or 45%.
For surveys in several countries, there's one more issue: whether the top level means the same thing in every country. Specialists call this scale equivalence (Malhotra and Birks 2007, p. 759).
My advice: compare yourself with yourself. Ask the same way over time, with the same wording, the same scale, at the same point and through the same channel. Whenever the score changes, look at the interval, as shown in the section Comparing two measurements.
When CSAT is useful
CSAT is flexible. The question can be adapted to any aspect of the interaction between customer and company, and that's exactly its most common application.
Touchpoint diagnostics: "How satisfied were you with your last call to the hotline?" Instantly gives you a basis for comparing service quality across shifts and locations.
Product and process feedback: "How satisfied were you with the delivery of your order?" or "How satisfied were you with the salesperson's helpfulness?" Several CSAT questions combined in one survey give you a more detailed diagnostic picture.
Trend measurement: same wording, same scale, defined waves. Changes over time are immediately visible.
CSAT survey questions by touchpoint
The CSAT question always follows the same pattern: "How satisfied were you with …?" What matters is what comes after "with". The more precisely you name the contact, the more clearly respondents know which moment you mean. A few wordings beyond the examples above:
| Touchpoint | Question | When to ask |
|---|---|---|
| Purchase in an online store | "How satisfied are you with your purchase in our online store?" | right after the order |
| Customer service chat | "How satisfied were you with the help you received in our chat?" | at the end of the chat |
| Repair shop or on-site appointment | "How satisfied were you with your repair shop appointment?" | at pickup or shortly after |
| Software setup | "How satisfied are you with the setup of your account?" | after the setup is complete |
| Seminar or event | "How satisfied were you with the seminar overall?" | at the end or the day after |
| Complaint | "How satisfied are you with how your complaint was resolved?" | after the case is closed |
When I word these questions, I pay attention to four things:
- One thing per question. "How satisfied were you with the friendliness and the speed of our staff?" leaves it unclear what the answer refers to. Someone who was served in a friendly but slow way doesn't know which answer to check.
- Label all five levels, symmetrically and with a neutral midpoint, as in the table in the repair shop example. You'll find proven labels in the list of common Likert scales.
- Don't change the wording as long as you want to compare scores over time. Otherwise you won't know whether the customers have changed or the question.
- Ask why. An open follow-up question such as "What could we have done better?" tells you what's behind a low score. I describe how to analyze such answers in the article on the Net Promoter Score.
Where CSAT reaches its limits
CSAT captures a snapshot: the impression after exactly one touchpoint with the company. The score does not directly describe the long-term customer relationship.
A customer who was "very satisfied" with their last call to the hotline may still switch at the next contract renewal, because the overall balance of price, product quality, and competing offers looks different. If you want to capture willingness to recommend, you can add the Net Promoter Score (NPS). This intention alone doesn't show whether customers actually stay loyal. If you want to capture the perceived effort in resolving a problem, you need the Customer Effort Score (CES).
Satisfaction arises when the experience confirms the expectation, and it increases the willingness to buy again and to recommend (Reichheld 2004, cited in Braun and Müssigmann 2009, p. 9). But that effect isn't guaranteed. Many customers don't buy again despite being satisfied (Reichheld 1997, cited in Braun and Müssigmann 2009, p. 140). A report by Harvard Business Review Analytic Services (2019, p. 15) also quotes the observation that many of those responsible for customer experience are fixated on metrics such as NPS or CSAT instead of paying attention to the value for the business. My advice: take CSAT as a pointer to touchpoints where something isn't working, not as a goal in itself.
Practical recommendation
Use CSAT right after each relevant touchpoint. Ask a short question about that interaction instead of collecting feedback on several interactions in one questionnaire at the end of the quarter. For the strategic view, complement it with NPS (loyalty) and CES (perceived effort). In QUESTIONSTAR you measure all three with the NPS question: NPS with the classic scale, CSAT and CES with your own thresholds, and for CSAT and CES you read the share of "promoters".
CSAT, NPS, CES: which question measures what?
CSAT: satisfaction after a touchpoint. "How satisfied were you with [interaction]?" Point-in-time diagnostics.
NPS: loyalty and willingness to recommend. "How likely are you to recommend us?" A strategic indicator.
CES: perceived effort in resolving an issue. "The company made it easy for me to resolve my issue." Friction diagnostics.
At a glance, how the three metrics are calculated:
| CSAT | NPS | CES | |
|---|---|---|---|
| Asks about | Satisfaction with one contact | Willingness to recommend | Effort for the customer |
| Usual scale | 1 to 5 | 0 to 10 | 1 to 7 (agreement) |
| Metric | Share of 4-5 (top-2-box) | Share of 9-10 minus share of 0-6 | Share of 5-7 |
| Range | 0 to 100% | −100 to +100 | 0 to 100% |
The NPS figures follow Marx (2016, slide 77), and the CES figures follow Gartner's variant (Gartner 2018). You can read how to calculate and interpret the NPS in the article Net Promoter Score (NPS). I explain the CES in the article Customer Effort Score (CES). With the calculator above, you can switch between all three.
For an overview of the combined use of NPS, CSAT, and CES, see the page NPS, CSAT, and CES in QUESTIONSTAR.
A template for your CSAT survey
If you don't want to start from scratch, take the template Customer Satisfaction: repeat survey. As the name says, it's meant for surveys you repeat at intervals so you can compare yourself with your earlier scores. You'll find more templates on the topic under Templates.
You copy a template into your account with a button inside the opened template. If you don't have an account yet, register for free first. Then adapt the question to your touchpoint.
Frequently asked questions about CSAT
How do you calculate CSAT?
Count how many respondents chose a 4 or a 5 on the scale from 1 to 5, and divide that number by all answers, including the neutral and the dissatisfied ones. Multiplied by 100, this gives CSAT as a percentage. With 160 satisfied out of 200 respondents, that's 80%.
Top-box or top-2-box?
On this page and in the calculator, top-2-box is the standard, so 4 and 5 together. The top-box counts only the 5s and is stricter. It's worth using when almost all answers are 4 or 5 and you want to see whether "somewhat satisfied" turns into "very satisfied". Decide once, state the counting rule in the report and don't switch it between two measurements.
What is a good CSAT score?
There's no universal threshold, and QUESTIONSTAR doesn't provide industry benchmarks. Compare your CSAT with your own earlier measurements, with the same question through the same channel, and pay attention to the interval. More on this above.
What's the difference between CSAT and NPS?
CSAT asks about satisfaction, usually with a specific contact, and counts the share of the two top levels. NPS asks about willingness to recommend and subtracts the share of detractors from the share of promoters. That's why CSAT runs from 0 to 100%, and NPS from −100 to +100. More in the article Net Promoter Score (NPS).
How many answers do you need for CSAT?
For an approximate margin of error of ±5 percentage points at a 95% confidence level, planning for independent random observations gives 385 valid answers in the worst case, and 246 if you expect a CSAT of about 80%. For ±10 percentage points, the same planning gives 97 and 62 respectively. With fewer than 30 answers, pay particular attention to the uncertainty and to who was selected to answer. You'll find the calculation above.
Sources
Braun, O. L. and Müssigmann, M. J. (Eds.) (2009). Kundenbefragungen. Eine Sammlung von Fallstudien [Customer surveys: a collection of case studies]. Pabst. In German. pp. 9, 140.
Gartner (2018). What's Your Customer Effort Score? Article by Jordan Bryan, July 12, 2018. Archived original.
Harvard Business Review Analytic Services (2019). Beyond Big Data: Why Small Data Integration Is the Key to CXM Success. p. 15.
Linke, R. (2018). Mitarbeiterbefragungen optimieren. Von der Befragung zum wirksamen Management-Instrument [Optimizing employee surveys: from the survey to an effective management tool]. Wiesbaden: Springer Gabler. In German. p. 105.
Malhotra, N. K. and Birks, D. F. (2007). Marketing Research: An Applied Approach (3rd European ed.). Harlow: Pearson. p. 759.
Marx, P. (2016). Principles of Survey Research (slide deck). Slide 77 (Net Promoter Score).
NIST/SEMATECH (n.d.). e-Handbook of Statistical Methods. Section 7.2.4.1: Confidence intervals.
Reichheld, F. F. (1997). Der Loyalitäts-Effekt [The loyalty effect]. Frankfurt/Main: Campus. In German. Cited in Braun and Müssigmann (2009), p. 140.
Reichheld, F. F. (2004). Mundpropaganda als Maßstab für den Erfolg [Word of mouth as the measure of success]. Harvard Businessmanager, 26(3), 22-35. In German. Cited in Braun and Müssigmann (2009), p. 9.
I hope your CSAT now means more to you than just a percentage.
I wish you many satisfied customers and answers you can learn from!
Dr. Paul Marx
Author: Dr. Paul Marx
Dr. Paul Marx is the founder and Managing Director of QUESTIONSTAR and was a professor of marketing at the University of Siegen.